What is the real value of the online world & digital convenience?
Key Takeaways
- 67.2% of respondents were paying less than $100 per month for their internet service, however, 50.3% of respondents valued it more than $100 per month.
- 5.1% of respondents reported that they would be willing to pay for improved targeted ads, while 28.1% of respondents claimed they would pay over $50 monthly to remove their social media ads altogether.
- Improved data privacy (61.4%) was respondents’ most wanted social media addition.
Cost of connectivity
Almost all things in this world, material or nonmaterial, are assigned some degree of value. Whether it’s digital or physical currency or sentimental value, most things are worth something, whether they’re tangible or not. Exploring how socialized groups and individuals assign value allows us to get a closer look at what people care about. In an era of convenience and interconnectivity, it may be particularly telling what gets cast aside and what doesn’t.
The conveniences of the digital age (e.g., social media platforms, subscription services and the internet itself) are what we’re primarily concerned with. We spoke to over 1,000 respondents to shed light on whether and to what extent people care about popular modern conveniences like the internet, social media platforms and subscription services. Read on to learn more.
How essential is the internet?
Beyond hosting incomprehensible amounts of information, the internet connects and supports people in myriad ways. We assessed how essential people believed the internet to be as well as how much time they spend using it.
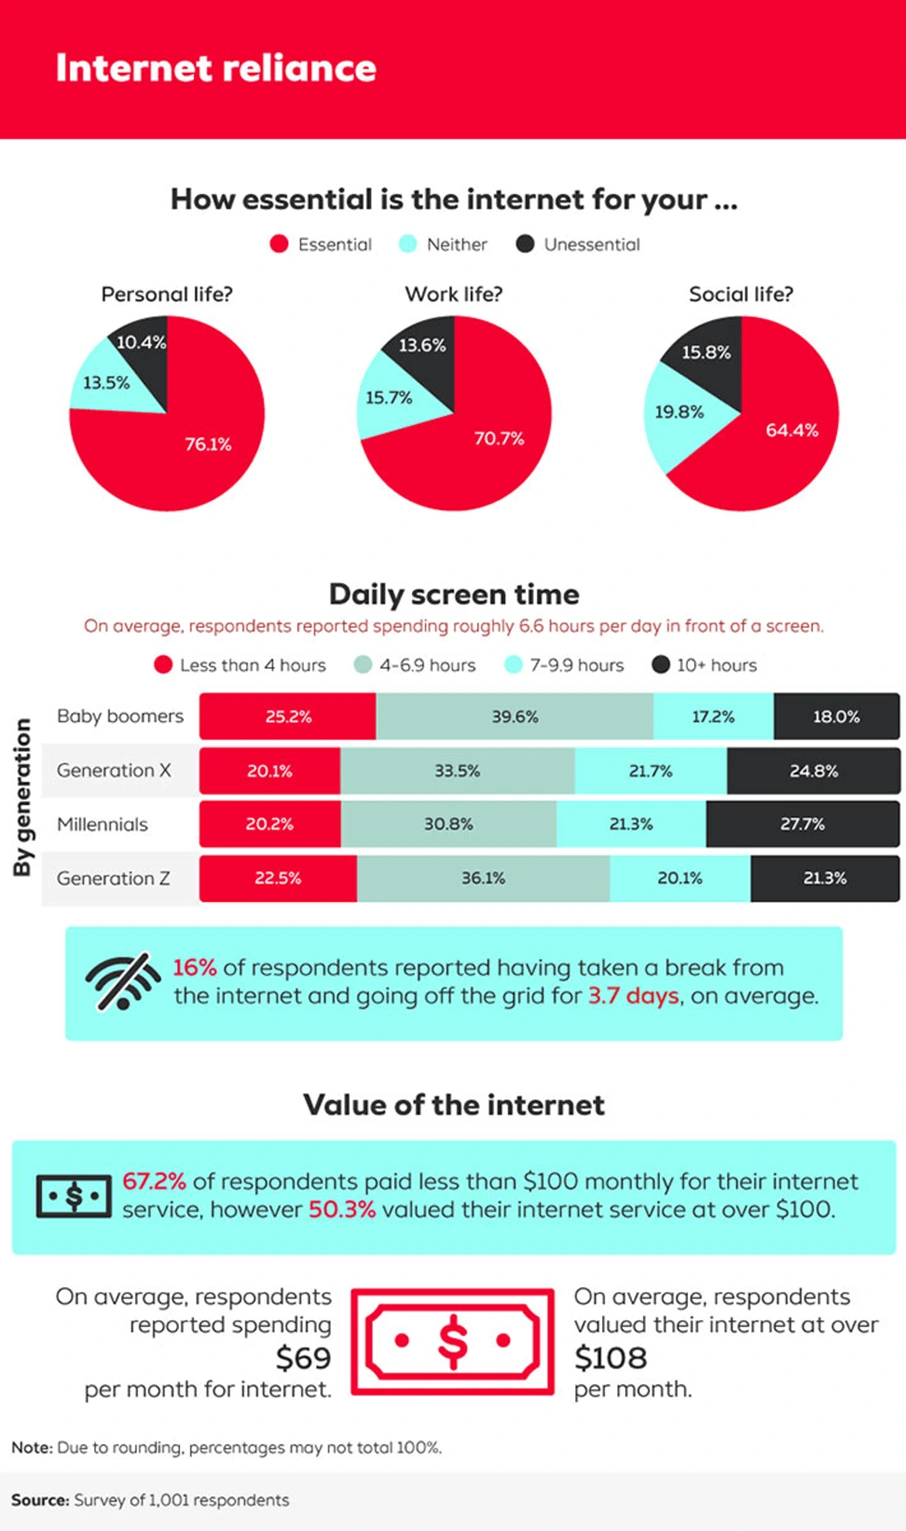
Overall, it appears respondents hold the internet in high regard. When asked how essential they believe the internet is for their respective personal life, work life and social life, a rather large majority of respondents (76.1% for personal, 70.7% for work and 64.4% for social) deemed the world wide web essential across all major categories. Given this information, we were naturally led to ask just how reliant the average person is and exactly how large or small the gap is between what respondents believe and how much they truly utilize the internet.
On average, respondents reported spending roughly 6.6 hours a day in front of a screen. Seeing as the average person spends 16–18 hours awake per day, this figure is nothing to dismiss. So, overall, it appears that respondents’ actions were consistent with their beliefs.
Across all generations, most respondents spend about four to seven hours per day on the internet overall and across various age groups. Intergenerational similarities aside, however, it appears that baby boomers are noticeably hesitant to accrue more than seven hours of screen time per day. More specifically, over 20% of all other generations (Generation X, millennials and Generation Z) reported spending seven to nine hours with a screen daily, and the same is true of spending 10 hours or more on screens per day. With regards to boomers, however, 17.2% spent 7–9 hours on screens per day, while 18% allotted 10 or more hours daily. Though these generational habits might seem marginally different, this trend might just explain why your friend’s dad doesn’t comprehend “OK, Boomer.”
Social media and targeted ads
Whether it’s a privacy concern, irritation or an appreciation for convenience, most of our respondents had some feeling associated with targeted advertising. Which way did they sway?
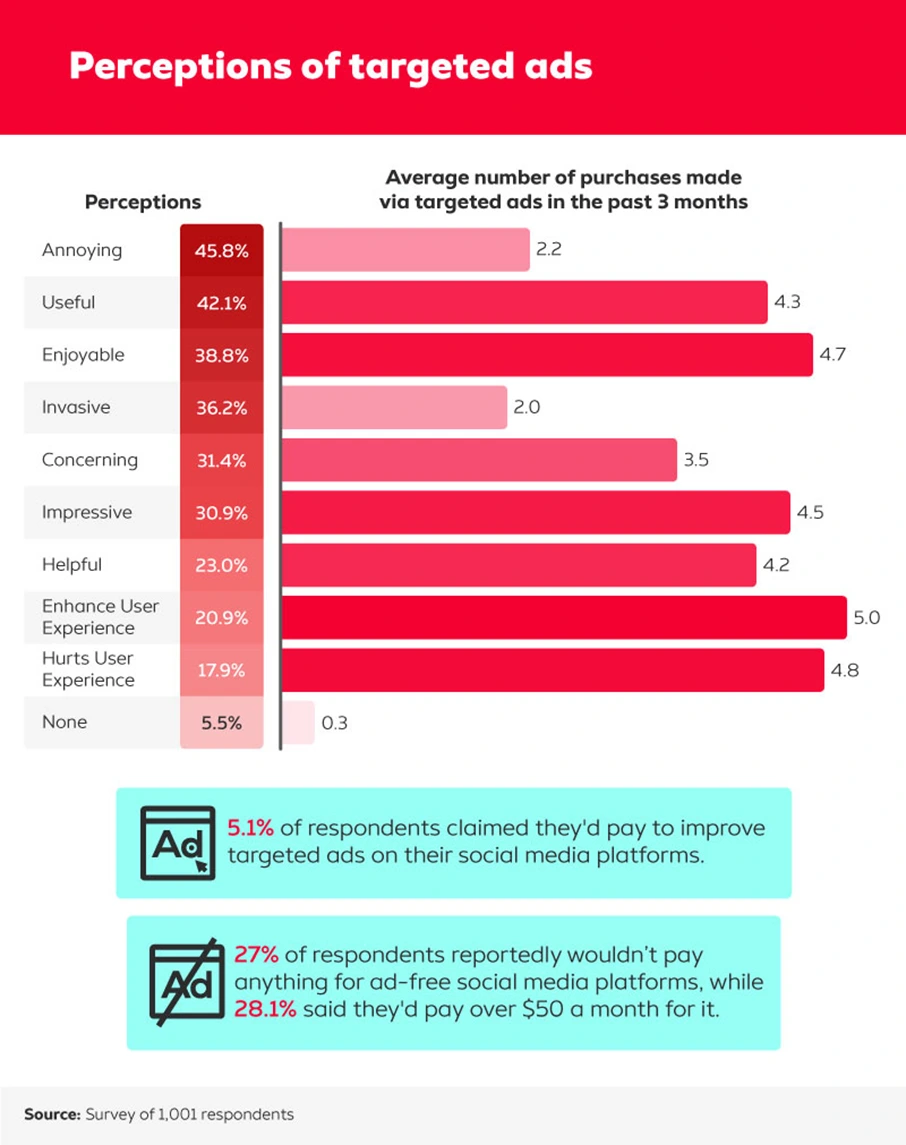
Overall, the most popular opinions contained both criticism and support. The top three perceptions of targeted ads, according to our respondents, were that they are annoying (45.8%), useful (42.1%) and enjoyable (38.8%). Additionally, respondents who believed targeted ads enhanced their social media user experience (20.9%) edged out the group who thought otherwise (17.9%). Still, despite feeling targeted ads hurt their user experience, respondents from this category belonged to the group with the second-most avid shoppers, having an average of 4.8 purchases via targeted ads within the last three months.
Intergenerational variation, on the other hand, could explain who targeted ads actually help.
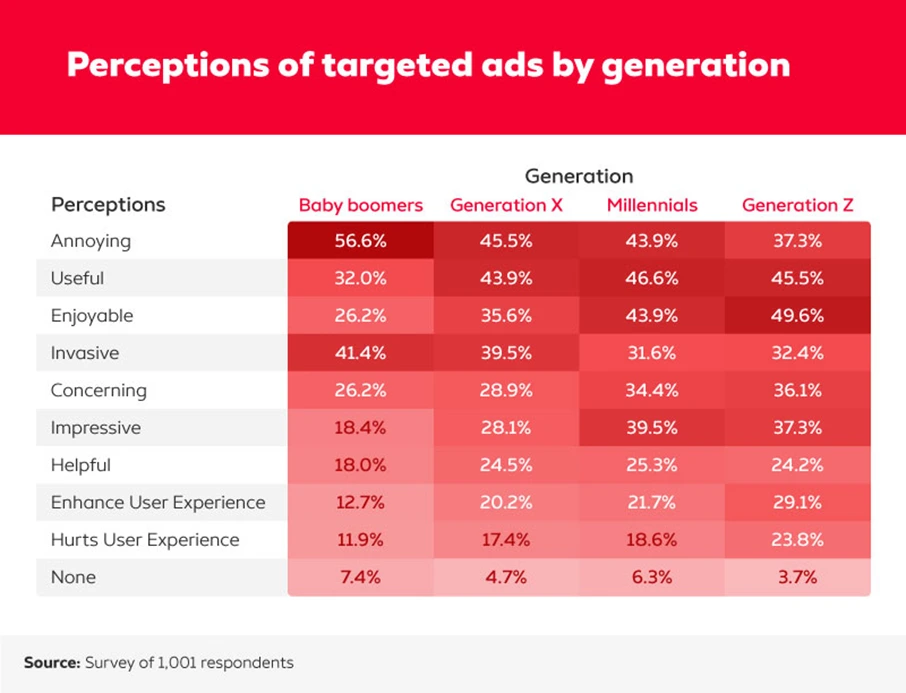
For the most part, it was observed that more critical opinions of targeted advertising were held by older respondents, and more supportive opinions were held by younger respondents. For example, there is a defined downward trend among respondents who found targeted ads to be annoying. From the 56.6% of annoyed baby boomers to the 37.3% of annoyed Gen Zers, there’s a steady decrease in proportions observable from one generation to the next. A similar trend exists for respondents who believed targeted ads were invasive. Starting at 41.4% of baby boomers in the “invasive” category, a steady decline in proportions continues across generations until it comes to Gen Z respondents (32.4%).
Targeted ads on certain social media platforms appear considerably more effective at winning over consumers than others.
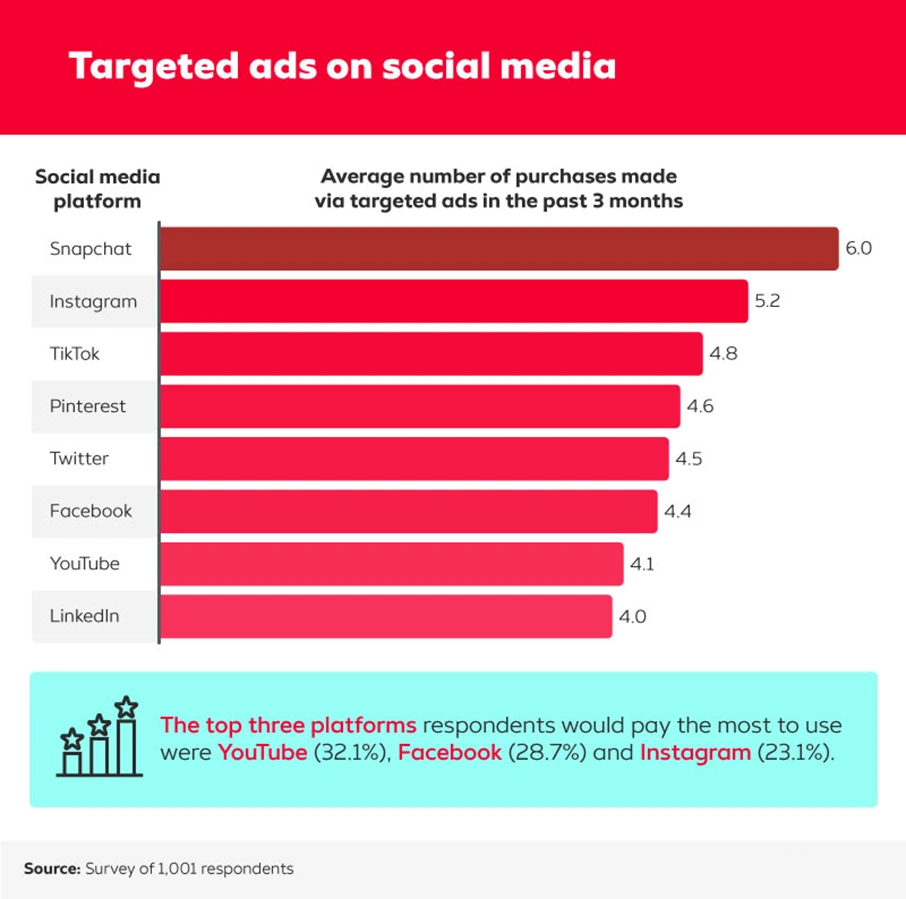
It was observed that the top three platforms by the highest average number of purchases in the last three months were Snapchat (6), Instagram (5.2) and TikTok (4.8), respectively. It was also observed that the top three platforms respondents were willing to pay the most to use were YouTube (32.1%), Facebook (28.7%) and Instagram (23.1%), the last of which was interestingly the only platform among these three that made the top three platforms for average number of purchases.
Leaving a lot desired
As has been thoroughly demonstrated in the case of Facebook’s massive-scale privacy breach, social media platforms leave a lot to be desired. So, what tops social media users’ wish lists?
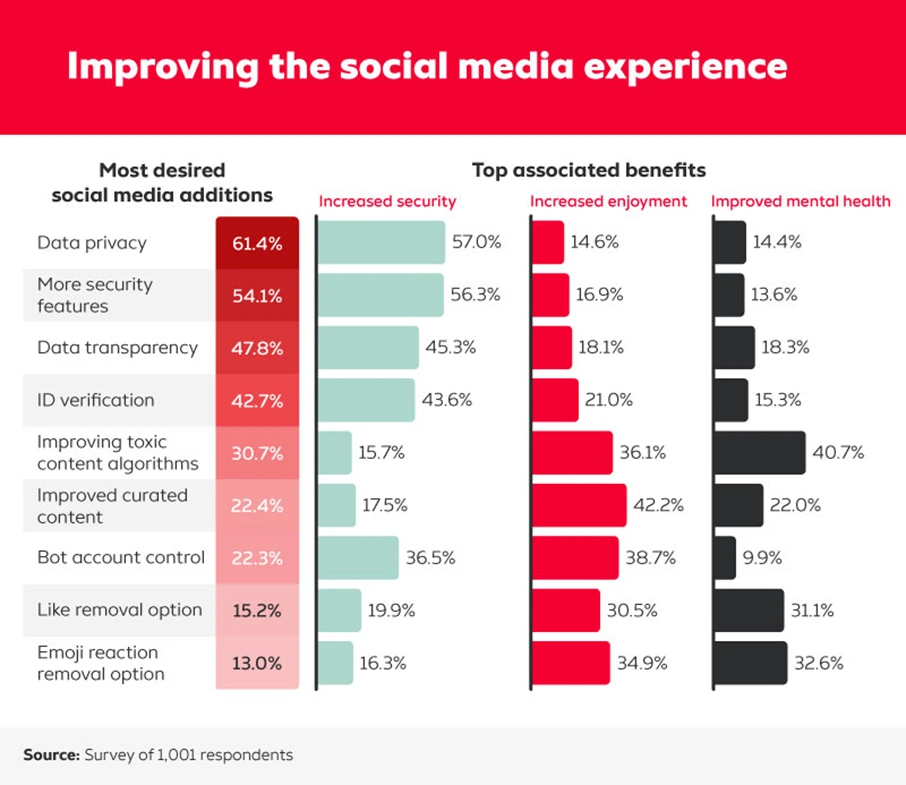
Data privacy was the most popularly desired addition to social media (61.4%), followed by additional security features (54.1%) and data transparency (47.8%). Data privacy was the addition most associated with increased security (unsurprisingly) at 57%. Improved curated content was the addition most associated with the enjoyability of social media (42.2%), and the addition of a toxic content algorithm, which would specifically remove negative posts and comments from appearing high on news feeds, was most associated with improved mental health (40.7%).
Is the subscription worth it?
People exchange currency for goods, services, experiences and even more money. In retrospect, it’s possible then to consider whether certain expenses give you an adequate return on investment (ROI) or are, in other words, ‘worth it.’ What subscription services do respondents feel fit the bill?
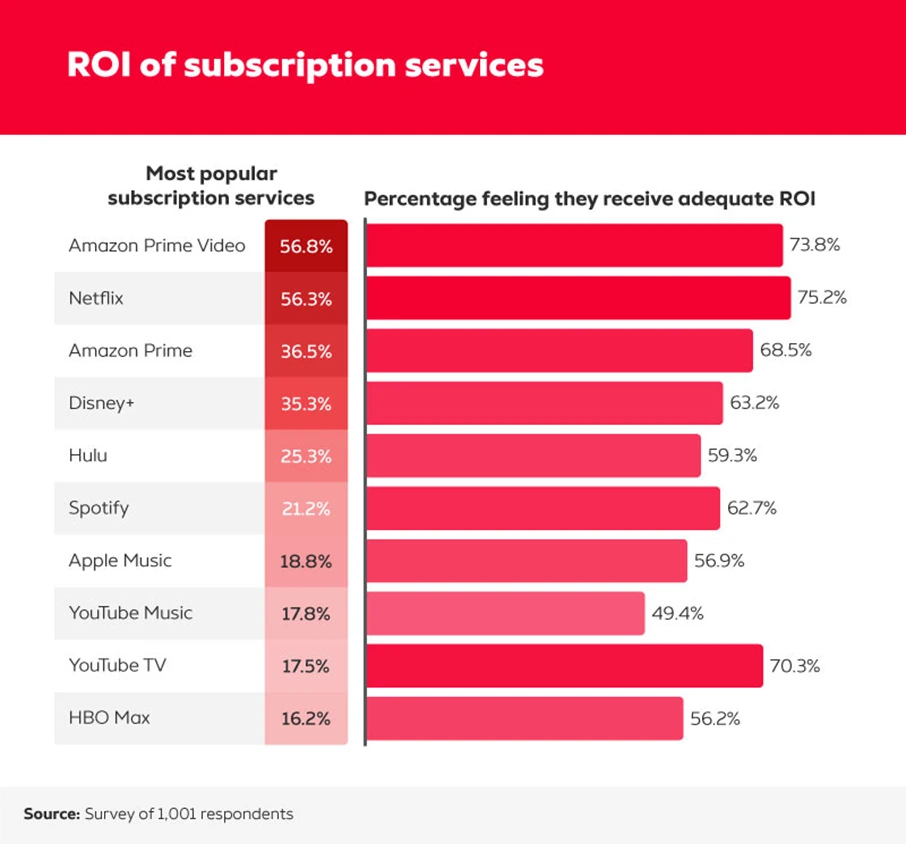
Overall, it was observed that Amazon Prime Video was the service respondents most commonly subscribed to (56.8%). Netflix, at a 56.3% subscription rate, and Amazon Prime, at a dramatically lower 36.5% rate, rounded out the top three most popular subscriptions. When it comes to the subscription services with the highest ROI, however, Netflix came out on top, with 75.2% of respondents feeling the service was worth the cost. The other subscription services for which more than 2 in 3 respondents felt a positive ROI were as follows:
- Amazon Prime Video (73.8%)
- YouTube TV (70.3%)
- Amazon Prime (68.5%)
What are subscriptions missing?
Technology itself is a result of wants and needs being manifested into tangible solutions. However, everything has imperfections, especially in the eyes of the nearly 60% of shoppers who use them. When it came to subscription services, what additional features were most desired?
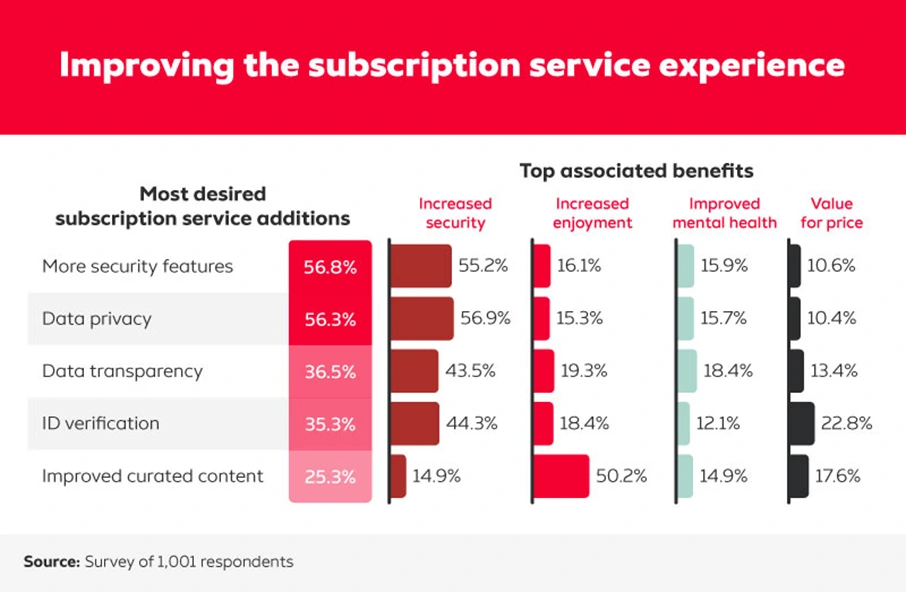
More security features were the most popularly desired additions to subscription services (54%), with increased security being the most popular foreseeable benefit (55.2%). Data privacy closely followed (53.5%) with an even greater association to increased security (56.9%). Nearly half of the respondents (46.1%) wanted subscription services to utilize ID verification, which was most associated with value for money (22.8%). Improved curated content was the least popular addition at 22.1% but was the feature that respondents felt would most make subscription services more enjoyable (50.2%).
The true internet evaluation
In many cases, concepts of worth varied across generations when it came to the internet. While targeted ads might seem invasive to a baby boomer, they might be convenient and useful for a millennial. There were many cases, though, where people of all ages found common ground, especially regarding the importance of their internet service and what additions are most desirable for social media platforms and subscription services.
Whether you need to hop on a Zoom call, watch your favorite Netflix series or want to kick back and stream that new album by your favorite artist, you won’t get very far without a quality internet connection. Frontier offers a powerful internet connection on a reliable network that’s optimal for work and entertainment, and all plans include the necessary Wi-Fi router and equipment. To start streaming or simply enjoying the internet, head to Frontier.com today.
Methodology and limitations
For this study, we surveyed 1,001 respondents via Amazon MTurk. 56.3% of respondents were men, 43.5% were women and the remaining 0.2% reported as nonbinary. Generationally, 25% of respondents were baby boomers, 25.4% were Gen Xers, 25.2% were millennials and the remaining 24.4% were Gen Zers. The average age of these respondents was 41 years with a standard deviation of 14.7 years.
The main limitation of this study is its reliance on self-report, which is faced with several issues, such as, attribution, exaggeration, recency bias and telescoping.
Fair use statement
It goes without saying that the things people value are worth discussing. So, it’s certainly to your advantage to further this conversation. However, please keep in mind that we are providing this information as a courtesy and as-is. We cannot accept any responsibility or liability for any inaccurate or incomplete reporting.